")
From Alaska to Washington, several of NOAA’s water level stations observed their highest recorded water levels.
December was an active month for NOAA’s National Water Level Observation Network (NWLON). A staggering eight stations observed all-time high water levels — some of which broke records in place for 40 years. The Pacific Northwest was the most affected region, with four locations in the state of Washington observing their highest-ever water levels on record.
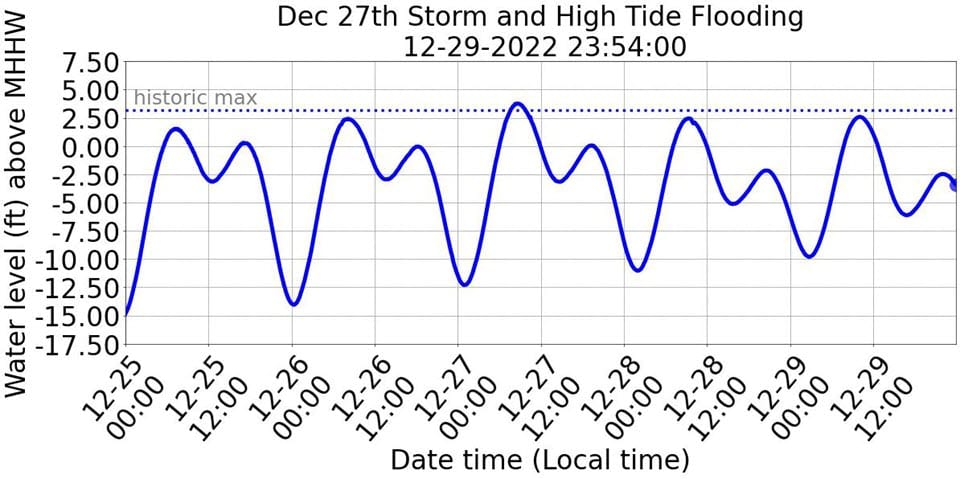 X-axis shows the date and time (Pacific Standard Time). The Y-axis displays water levels in feet above Mean Higher High Water. The dotted line in the graph shows the highest water level previously recorded at this location. The solid blue line shows the observed water levels in feet. (Photo credit: NOAA)
- Friday Harbor, Washington station: Water levels reached 3.60 feet (1.1 meters) above Mean Higher High Water (MHHW). This station’s previous record was 3.38 ft (1.03m) above MHHW, set on December 16, 1982. Station records go back to 1934.
- Seattle, Washington station: Water levels reached 3.76 ft (1.15m) above MHHW. This station’s previous record was 3.16 ft (.96m), set on January 7, 2022. Station records go back to 1899.
- Tacoma, Washington station: Water levels reached 3.90 ft (1.19m) above MHHW. This station’s previous record was 3.27 ft (1m), set on January 7, 2022. Station records go back to 1997.
- Port Townsend, Washington: Water levels reached 3.54 ft (1.08m) above MHHW. This station’s previous record was 3.08 ft (.94m), set on December 16, 1982. Station records go back to 1972.
In addition to Washington’s stations, new water level records were set at Quonset Point, Rhode Island, and two water level stations in Alaska: Sand Point and King Cove.
- Quonset Point, Rhode Island station: Water levels reached 3.72 ft (1.13m) above Mean Higher High Water (MHHW). This station’s previous record was 3.22 ft (.98m) above MHHW, set on April 16, 2007. Station records go back to 1999.
- Sand Point, Alaska station: Water levels reached 4.68 ft (1.43m) above Mean Higher High Water (MHHW). This station’s previous record was 4.25 ft (1.3m) above MHHW, set on December 31, 1986. Station records go back to 1972.
- King Cove, Alaska station: Water levels reached 4.98 ft (1.52m) above MHHW. This station’s previous record was 4.29 ft (1.31m), set on January 30, 2007. Station records go back to 1917.
- Nikolski, Alaska station: Water levels reached 2.82 ft (.86m) above MHHW. This station’s previous record was 2.54 ft (.77m), set on January 9, 2021. Station records go back to 2006.
Leading Contributors: High Tide Flooding and Winter Storms
High tide flooding happens when higher than normal high tides, such as a perigean spring tide, combine with sea level rise and, in some areas, coastal subsidence. While coastal flooding does not always occur during a perigean spring tide, it can increase the likelihood of minor high tide flooding in low-lying areas. This type of flooding, frequently seen during high tide and extreme weather events, exceeds established flood impact thresholds. Even minor high tide flooding events can result in inundated roads and backed up sewers. Weather conditions often compound this flooding, which can cause even more damage. This happened on December 27, 2022, when a strong winter storm hit the Pacific Northwest while tides were still above normal following the perigean spring tide.
Planning Ahead With NOAA’s High Tide Bulletin
Every three months, NOAA releases its High Tide Bulletin. This seasonal publication predicts when coastal regions of the U.S. will experience higher than normal high tides. The bulletin alerts coastal communities to periods of extreme tidal fluctuation and is part of a suite of tools designed to lessen the effects of high tide flooding.
In 2023, NOAA plans to unveil a new model to more accurately predict when and where high tide flooding will likely occur up to a year ahead of time. This represents a major advancement in the agency’s seasonal high tide flooding predictions.
More High Tide Flooding Expected in January and February 2023
NOAA predicts many coastal regions of the U.S. will experience higher than normal high tides between January and February 2023. The U.S. West Coast, in particular, may experience some of the highest tides between January 18-26 and February 18-21. These dates coincide with a perigean spring tide.
Link Between High Tide Flooding and Sea Level Rise
Predictions from last year’s Sea Level Rise Technical Report show that high tide flooding will become more common and more severe over the coming decades. As sea levels continue to rise, conditions that cause minor and moderate high tide flooding today will cause moderate and major high tide flooding by 2050. For example, the NOAA tide station at Seattle, Washington, can expect to see its high tide flooding days more than double between 2030 and 2050, increasing from four days a year to nine days a year.
NOAA is dedicated to providing America’s coastal communities with accurate and timely products and services to understand both near- and long-term inundation risks and impacts arising from severe weather events, high tide flooding, and sea level rise. To view relative sea level trends for the nation, visit the Center for Operational Oceanographic Products and Services’ sea level and coastal flooding information page.