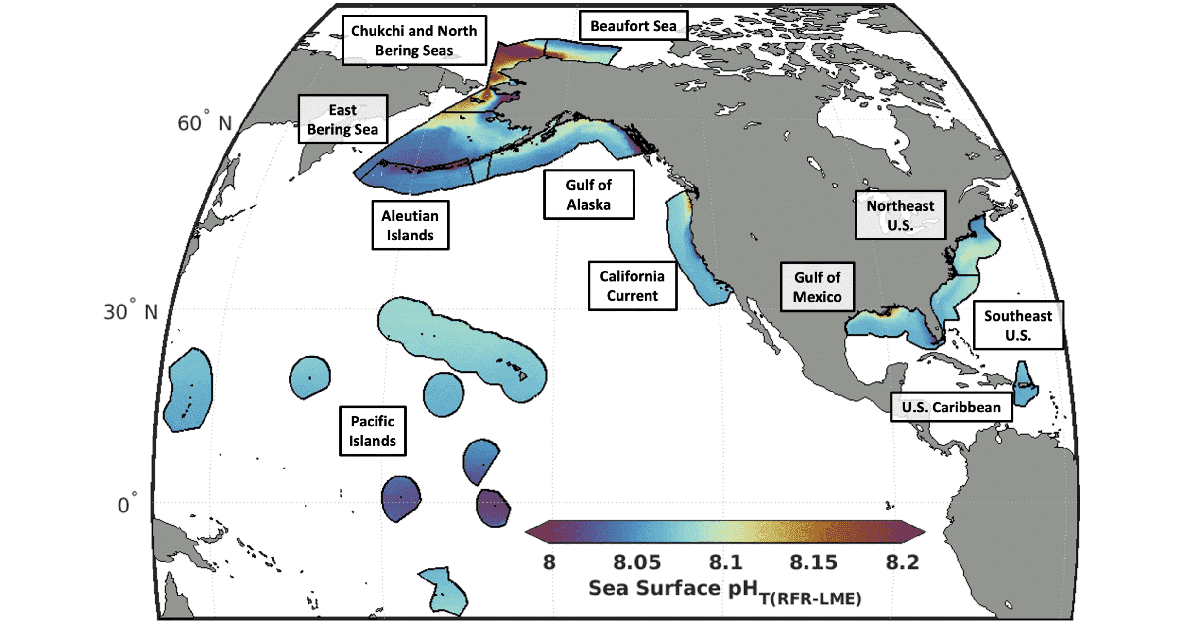
These graphs, charts, and mapped products, which were also described in a recent paper for Nature Scientific Data, provide a resource to fisheries and natural resource managers and deliver simple snapshots of ecosystem status with respect to ocean acidification.
“The dashboard provides a regional context for anyone who wants to know how ocean acidification is progressing in US coastal ecosystems,” said Dr. Jon Sharp, who led the work at the University of Washington Cooperative Institute for Climate Ocean and Ecosystem Studies and NOAA’s Pacific Marine Environmental Laboratory.
Ocean acidification occurs because our ocean is absorbing an increased amount of carbon dioxide (CO2) from the atmosphere.
Since the Industrial Revolution, the atmospheric concentration of carbon dioxide has increased by almost 50 percent due to human activities like the burning of fossil fuels and land use change. The ocean absorbs about 25 percent of the CO2 released into the atmosphere, causing a fundamental change in the ocean’s chemistry. While the ocean isn’t acidic, the chemical change is increasing the ocean’s acidity enough to impact some marine life and the people who depend on healthy ecosystems.
Ocean acidification can make it difficult for creatures such as oysters and clams to build and maintain shells made up of calcium carbonate. Acidification also affects other species vital to the marine ecosystem, including reef-building corals and some plankton eaten by fish and whales. The new ocean acidification dashboard shows trends in calcium carbonate saturation state, a measure of the concentration of these mineral building blocks for shells and skeletons.
The new ocean acidification dashboard uses data products created from surface ocean CO2 observations, gridded observational data products, two machine learning techniques, and algorithms trained on a global ocean database of carbonate chemistry measurements. The end result is a suite of maps and graphs that show trends in acidification over time and space for marine ecosystems in US waters.
“There’s a clear overall trend—our coastal waters are increasing in acidity, although there’s some regional variability,” said Sharp. “Areas closer to shore and high-latitude regions are more variable. Low-latitude regions with lots of open ocean, like the Hawai’i-Pacific Islands Region, show more steady changes over time.”
The indicators include pH, CO2 partial pressure that tells us how much carbon dioxide is in the water, and calcium carbonate saturation states for monthly timesteps from 1998–2022. The sourced data were from the Surface Ocean CO2 Atlas (SOCAT), and funding for this project was provided by NOAA’s Ocean Acidification Program. Learn more about what we measure for ocean acidification, including the variables used as indicators for this public tool.