")
Marine environmental researchers are on the mission to create robust and accurate data sets capable of deciphering ocean secrets and environmental phenomena.
But these large ocean data sets beckon for solutions in data visualization, processing, and storage. Meredith C. Payne, Senior Product Engineer at Esri shares her latest thoughts with ECO Magazine’s Editor Haley McQueen on the latest technologies capable of viewing the “hydrospatial” world.
 Meredith C. Payne, Senior Product Engineer, Esri.
HM: Could you share with us a little bit about yourself and how you came to work on the projects that you do at Esri?
MP: I am a total “Geo-nerd” at heart, and GIS has always been a fundamental part of my analytical toolkit. My career started in Planetary Geosciences, which necessarily meant doing geology via remote sensing techniques. My remote sensing work eventually led me to satellite oceanography and then to hydrography (mapping the seafloor by measuring water depths—also known as bathymetry).
HM: Can you give us more details about your current position and the projects you are on now?
MP: I am what is known as the Product Owner of ArcGIS Bathymetry. In that role, I lead the ArcGIS Pro development of that product. ArcGIS Bathymetry is an extension of ArcGIS with tools and workflows for performing data exploration and modeling of bathymetric data and metadata in a GIS environment. A product owner must have subject matter expertise—in my case, bathymetry, and hydrography—and have the ability to gauge and incorporate the wants and needs of the software users. A product owner is not a software coder but must have enough knowledge of the developer’s code to be able to read, review, and understand what it does and to suggest viable changes to benefit the product. A product owner also raises awareness of the product and assists their users with learning to use and troubleshoot the product. They are the interface between the customers and the developers.
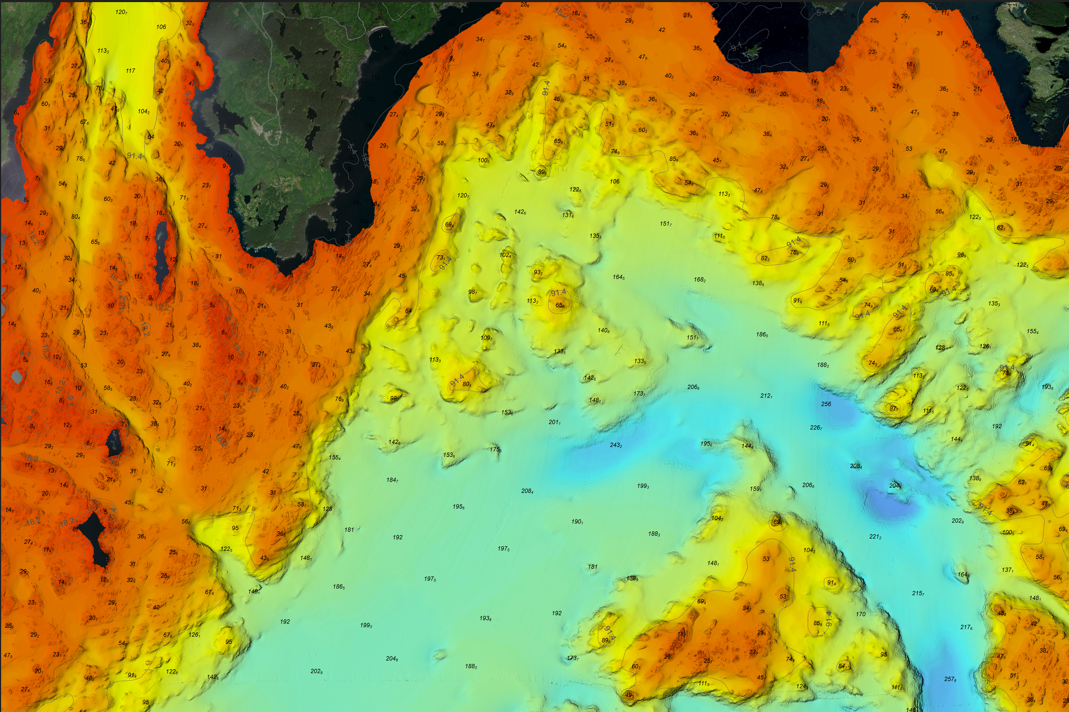 Marmot Bay, Kodiak, AK, multibeam sonar bathymetry overlain with charted soundings and contours. (Image credit: NOAA/Esri)
HM: Can you explain the benefits of looking at ocean data through a spatial lens?
MP: It has been said many times over that our blue planet is more than 70% water. We need a toolkit that can address the challenges we currently face in our fragile and changing water world. We want to understand where important resources exist in space and time as we move much-needed cargo globally to reach the populations requiring the supplies. We need to be able to plan for buffering and building more resilient coastlines where water is encroaching on regions with the greatest population densities. We have to manage fisheries and other oceanic resources sustainably, so they can remain healthy and abundant over time. Each of these problems must be examined from a geospatial perspective to get the most accurate picture that allows us to formulate the best approaches. None of these marine issues exists in a vacuum—they form a complex and interwoven web of systems affected by coincident processes. GIS provides a fundamental framework with which to examine our “hydrospatial” world.
HM: What are some of the common uses of GIS you see for oceanography and the ocean industry?
MP: The use of GIS is extremely prevalent in the oceanographic and maritime industries. GIS is heavily used in nautical cartography to create charts for navigation. GIS is also used in nearshore environments for coastal modeling of sea-level rise and tsunami run-up, and in the deep ocean to map geologic features and analyze geologic hazards. Furthermore, GIS is used to map and analyze marine habitats and ecosystems. Suitability analysis with GIS is used in the fields of offshore energy, to locate wave or wind energy installations, and also in the telecommunications industry for laying oceanic cables between continents. The use of GIS in the ocean industry is limitless.
HM: What advances have allowed GIS and remote sensing to be applied and layered with discrete sampling data?
MP: Ocean data is notoriously voluminous and unwieldy. The capacity to store and use “big” data, combined with the ability to share and serve the data through websites and web applications, has allowed these vast stores of remotely sensed data (such as sonar and LiDAR data) to be viewed and used together with local data collected in situ. The data samples provide crucial ground truth for remotely sensed data and allow us to create increasingly accurate data models, such as digital twins. Digital twins are growing in popularity and use in both nearshore and offshore communities of practice.
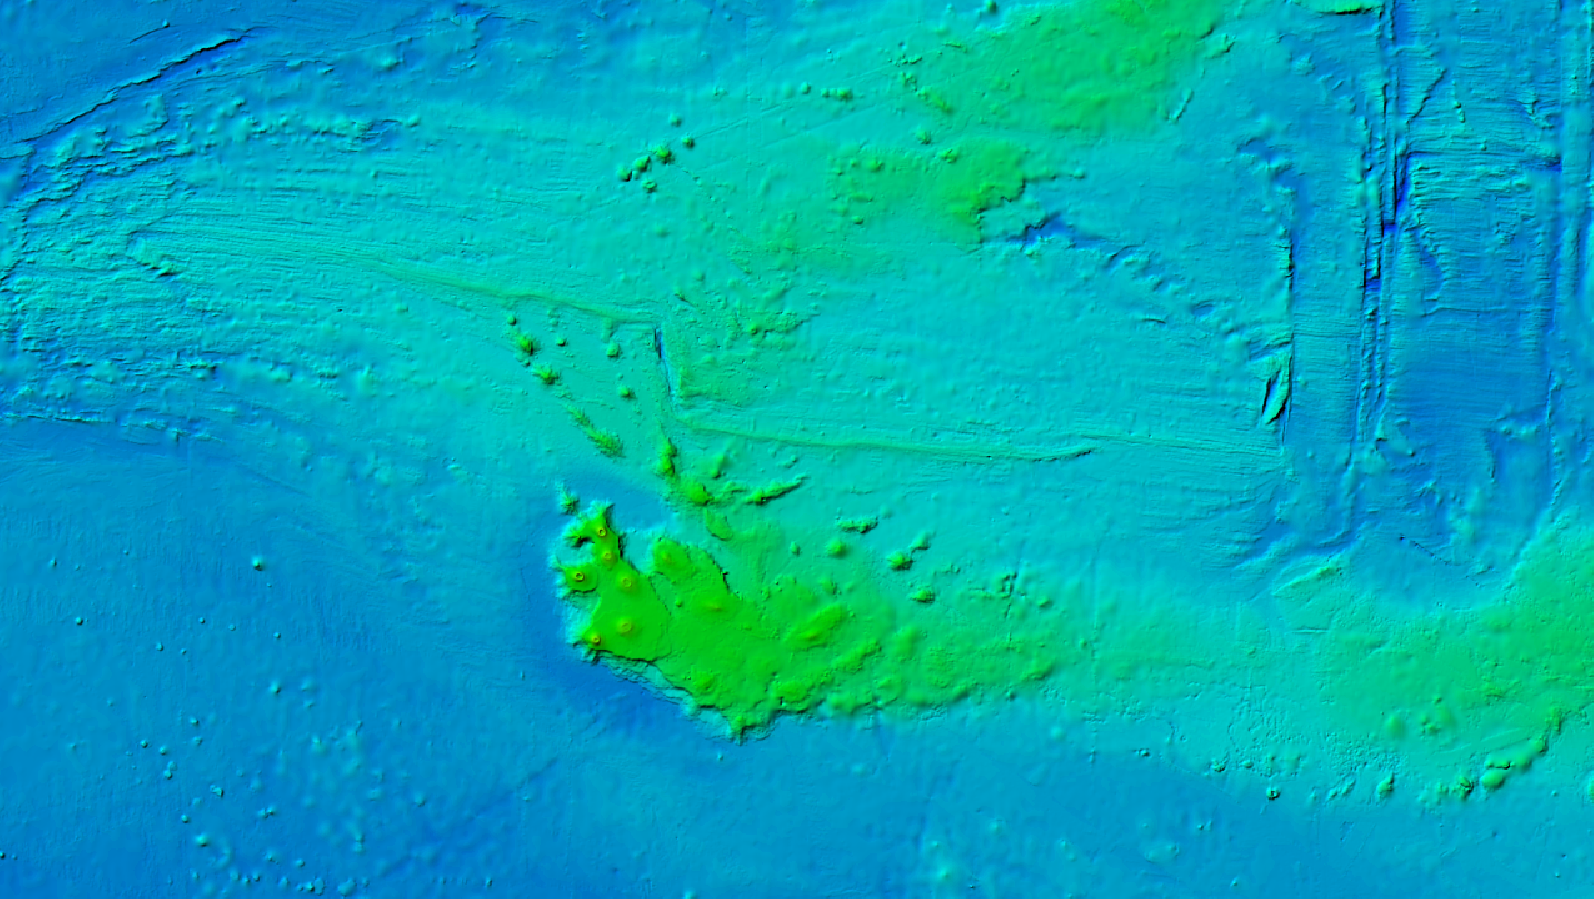 ArcGIS Living Atlas of the World view of the GEBCO Bathymetry 2022 gridded bathymetry layer showing Galapagos Islands and the Galapagos Fracture Zone. (Image credit: GEBCO Compilation Group 2022/Esri)
HM: Can you detail some of the ways you can apply ArcGIS to ocean bathymetry?
MP: Bathymetric data, especially hydrographic data, relies on a high degree of vertical and horizontal accuracy. This is necessary to map depths and obstructions that can pose a threat to marine navigation and to identify what traffic can safely transit into certain ports and harbors based on vessel drafts. From nearshore nautical cartography to underwater feature maps of the deep ocean, ArcGIS Pro provides solutions to capitalize on the “where” of your bathymetric data and use the abundance of available statistics, analytics, and visualization tools to derive the most information possible from your depth data. Examples of this include predictive sedimentation analysis that can inform dredge planning in ports and harbors, volumetric calculations to inspect navigation channel depths, and contouring and sounding selection tools for bathymetry-to-nautical chart workflows. ArcGIS Pro can also leverage the true 3D nature of bathymetric data and allow users to visualize and analyze bathymetric and water column data with tools such as voxels (3D pixels) and 3D meshes.
HM: What is ArcGIS Maritime, and what are the benefits of the technology?
MP: ArcGIS Maritime is an extension for ArcGIS Pro that allows users to create nautical charts that comply with standards set by the International Hydrographic Organization (IHO). ArcGIS Maritime provides solutions for chart creation on the desktop and chart distribution solutions through Maritime Chart Server. Furthermore, the Custom Chart Builder (CCB) application allows users to create nautical charts on demand with customized regions, features, and symbology. ArcGIS Maritime and ArcGIS Bathymetry are distinct and separate extensions for ArcGIS Pro.
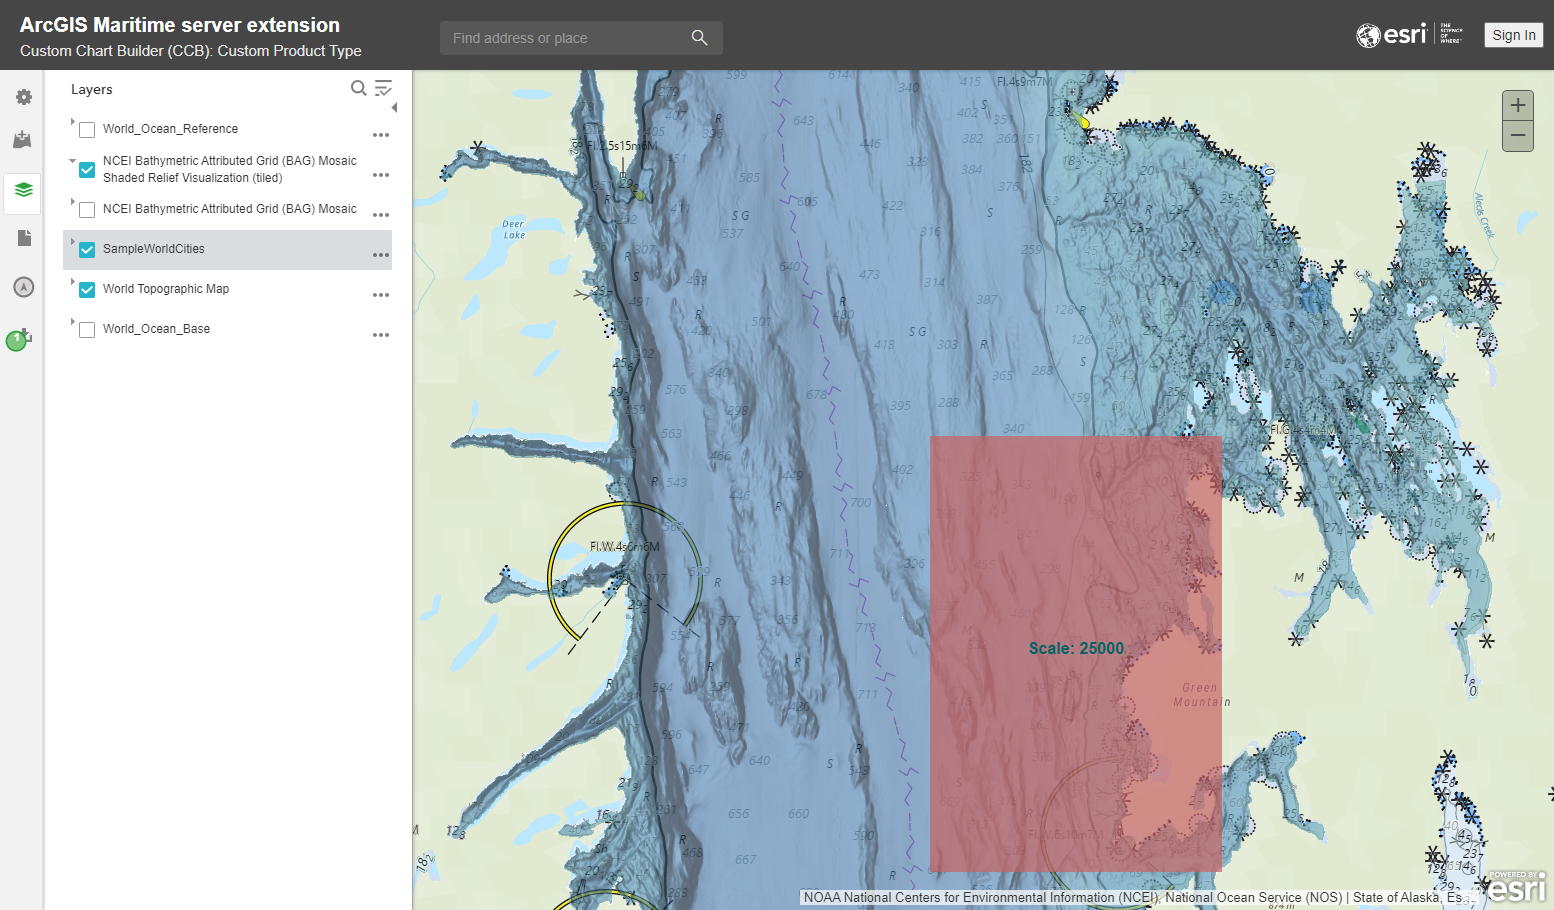 ArcGIS Maritime’s intuitive web-based Custom Chart builder used to automate paper chart production and create information products using S-57 ENC datasets, bathymetry services, and data overlays. (Image credit: Esri)
HM: What themes, trends, or directions do you foresee GIS and remote sensing to be used in the ocean industry in the future?
MP: Technology is on the path of automation, artificial intelligence, and machine learning. There is a significant and growing trend of uncrewed vehicles used for survey and inspection for maritime projects. GIS and remote sensing are as integral to planning surveys with an autonomous marine vehicle as it is with a crewed survey vessel. GIS is crucial to transit and track planning and data collection with autonomous vessels so that the mission can be executed completely and successfully. Combinations of sonar, topo-bathymetric LiDAR, aerial, and satellite-derived bathymetry can be used to train GIS machine learning models to automate the identification of coastlines and perform rapid detection of underwater objects and hazards present in vast amounts of data. I think we will see continual improvement of such models that will enable the refinement of object detection and categorization. This will lead to the ability to do such detection effectively to aid both routine and emergency marine operations.
Q: Are there any upcoming projects, technologies, or topics we did not touch on that you would like to share with ECO readers?
I would encourage readers with interest in oceanographic and maritime applications of GIS to attend Esri’s Ocean, Weather, and Climate GIS Forum. This is held each fall, usually during the first week of November, in Redlands, California. During the forum, participants can attend workshops and presentations given by their peers and engage in discussions emphasizing the synergy of GIS and ocean sciences.
This exclusive feature was published in Environment, Coastal & Offshore (ECO) Magazine’s Deep Dive II: Marine Environmental Research. To read more features like this one, visit: http://digital.ecomagazine.com/publication/?i=796853&p=44&view=issueViewer.