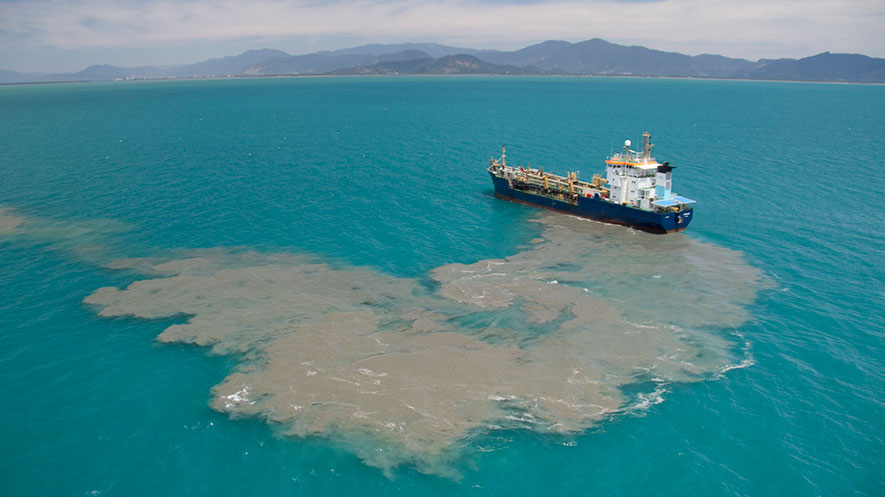
In all dredging operations there will inevitably be a certain amount of sediment spill. As with all environmental pollution, authorities may regulate the spill, requiring it to be measured.
The approach taken for decades in the U.S. is to measure the turbidity in the water column using an instrument design defined in the law itself (90º reflected white light from a Tungsten light source, calibrated using Formazin, the units of which are called NTU, nephelometric turbidity units). The law limits the maximum NTU value any-where in the sediment plume. This is a low-cost method of measuring, but it is not very effective for various reasons. First, it limits the “cloudiness” of the water rather than the sediment concentration, which can vary by an order of magnitude for the same turbidity. Second, it only limits the maximal turbidity at the edge of a 150 m mixing zone, not the amount of sediment spill. Third, anyone with insight into the 3D nature of the spill plume will realize that it is easy to deliberately avoid the peak values when measuring it in the field, and since the measurements are the responsibility of the project owner and not of the environmental authorities, this invites cheating.
When dredging for the construction of the bridge-tunnel between Sweden and Denmark, a very different approach was used. In terms of regulation, the sediment spill was limited to 5% of the dredged amount, and it was to be measured with an accuracy of 1%. The measurement method was up to the project owner, but it had to be approved by the supervising authorities. They chose to tow a vertical array of turbidimeters along the limit of the work zone, back and forth for the duration of the project, and use statistics to interpolate in time and space between the measurement points. The turbidimeters used 180º reflected near infra-red light (formazin backscatter units, FBU). The FBU values were converted to sediment concentration by analyzing water samples taken in the plume. This method worked; the builder did manage to measure the sediment spill to better than 1% uncertainty (and to keep the spill under 5%). It did, however, have two drawbacks: First, it was expensive. Second, while it did work in terms of regulating the sediment spill, it doesn’t necessarily work so well for regulating sediment pollution.
The thing that both the mentioned methods fail to account for is that not all sedi-ment spill is pollution. Sediment is an integral and necessary part of nature. It’s like water: Too much of it in the wrong place leads to floods, but too little leads to droughts. We want the water in some places and times, but not in other places or at other times. To cre-ate a cost-effective regulation regime, one must also consider the environmental harm, and how to best avoid or mitigate it.
First, the focus should be on that part of the sediment spill that amounts to pollu-tion. In rivers the plume of suspended sediment will cover the entire river and there is no escaping it even for fishes, but in the open sea the plume can be — and is — avoided by the fish. Case in point, there was a concern in the bridge project that eel, which follow the coastline, would be affected by the spill plume when it touched the shoreline, but appar-ently the eel just swam around the plume on the seaward side. The environmental effect of the plume was therefore primarily on the bottom-living (sessile, benthic) organisms. They are affected by three factors: (a) sediment accumulation on the bottom and over the living organisms; (b) increased near-bottom suspended sediment concentration; and for primary producers also (c) a decrease in the incident light due to turbidity higher up in the water column. Thus, the monitoring should ideally measure one or more of these three factors.
Second, mitigation is expensive, so even if we disregard the moral aspect it is often more cost-effective to avoid harming the environment in the first place. Many factors af-fect the sediment spill, and quite a few of them can be influenced by the way the project is executed, the way the equipment is used, or the timing of activities. However, optimiz-ing these aspects requires feedback from the sediment monitoring data with sufficient temporal resolution, which disqualifies “before and after” inspection schemes. Further-more, depending on the currents the spill plume impacts different areas of the bottom, some of which may be much more sensitive than others. With access to real time meas-urement data of sediment pollution on the bottom, an alarm can be generated and mitigat-ing measures be taken before harm is done.
Third, the avoid stifling development the regulation should be expressed in terms of physical parameters rather than as a measurement value obtained with a specific instru-ment design. For example, sediment accumulation could have a threshold in millimeters, and sediment concentration in grams per liter. The threshold should of course be set with consideration for the sensitivity of each biotope, so that harm can be avoided by dredging faster when the current goes towards a non-sensitive area, and more carefully or not at all when the plume is heading towards a sensitive spot.
And finally, there should be an error margin, an uncertainty, associated with the threshold value. Specifying an uncertainty is necessary for auditing and enforcement. Since it is impossible to measure everywhere all the time, the monitoring will be limited to a sample of points in space, and a sample of measurements in time. By specifying the un-certainty rather than the method, the selection of monitoring method can be made based on what is most cost-effective in each case.
Monitoring Methods
The idea behind the proposal I first presented 10 years ago in a white paper is to regulate the relevant parameters with a threshold and an uncertainty in time and space, thus leaving it open for industry to develop more and more cost-effective methods for monitoring, without any artificial restraints as to technology or informatics. For instance, monitoring sediment accumulation on a sensitive bottom can be made with divers who visit the same stations regularly (this is standard practice in Florida); or it can be done with repeated acoustic surveying using side scan sonar and or multi-beam echo sounder (this was used in the Øresund bridge project); or it can be done by deploying a network of SediMeter instruments.
Divers make one measurement per station per week at most, but typically much more seldom. It is therefore essentially a “before and after-survey.” The number of meas-urement stations is low, not more than a handful. This means that there is an uncertainty of the true value between the stations (this uncertainty can be estimated using kriging) as well as between the measurements in time. In each visit, the divers measure the average sediment thickness at each station, by measuring the sediment thickness in many points with a ruler (in the order of 30 to 50, to account both for local variability, and for the fact that they cannot return to the exact same spot the next time around). This gives them an average and a standard deviation, which accounts both for the local variability, equivalent to the “nugget effect” in kriging, and the measurement error due to the method. The sed-iment accumulation is then calculated as the difference before and after, and the uncer-tainty in the difference is of course larger than the uncertainty in each average. This method thus has a significant uncertainty in the sediment accumulation value at a specific time and location; an uncertainty between the times; and an uncertainty between the loca-tions. It also requires a lot of diving.
The spatial uncertainty may be decreased by remote sensing. Side scan sonar can show the difference between hardbottom and sediment-covered hardbottom in a qualita-tive way (e.g., it can answer the question “has the muzzle bank been covered by sedi-ment?”). However, it says nothing about what happens between the surveys. For this, permanently deployed monitoring instruments are needed.
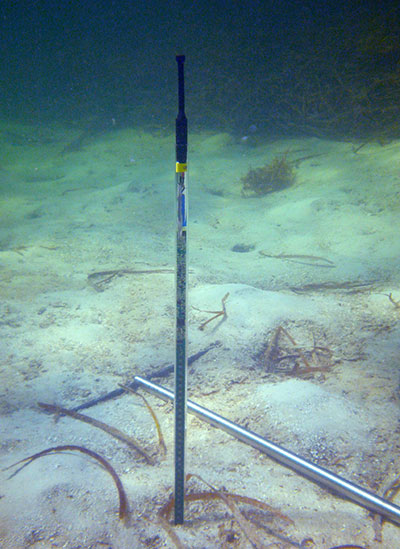 SediMeter instruments continuously monitor changes in the bed level. In contrast to the diving method described above, the SediMeter measures at the exact same spot all the time, eliminating one of the sources of uncertainty. It also measures with a much higher accuracy than a diver is capable of. To account for local variability, a few instruments can be placed at each station (3 is suggested, as compared to 50 measurement points in manu-al measurements). Since a dredger moves during the execution of a project, the area af-fected by the spill plume will also move. To make optimal use of a limited number of in-struments, some of them can be moved along with the dredger as the work progresses. The deployment pattern of instruments can be continually optimized by estimating the spatial uncertainty (using kriging). This maximizes the cost-benefit from the monitoring.
A SediMeter instrument deployed by screwing it down in the sediment.
Another benefit, unique to continuous real-time monitoring data, is that an alarm can be generated so that mitigating measures can be taken immediately when sediment accumulation starts occurring in a sensitive area.
The most cost-effective method will depend on local conditions, and regulatory re-strictions in terms of pollution limits and required accuracy in its estimation. For the max-imal accuracy (i.e., lowest possible uncertainty in time and space) within a given budget the best option is likely to be a pre-survey with side-scan sonar, deployment of real-time monitoring SediMeters, continuous follow-up of the spatial uncertainty with kriging, and a post-survey with side-scan sonar to verify that there was no sediment accumulation in between the measurement stations. If significant sedimentation is detected, a side-scan sonar survey can also be made to verify the extent of the impact on hardbottoms. For more information, visit sedimeter.com.
By: Ulf Erlingsson, Ph.D.