Researchers at William & Mary's Virginia Institute of Marine Science have issued the first annual update of their sea level "report cards," marking 50 years of water-level observations from 1969 through 2018.
These web-based charts -- available online -- project sea level out to the year 2050 based on an ongoing analysis of tide-gauge records for 32 localities along the U.S. coastline from Maine to Alaska. Release of this year's cards was delayed by the 35-day government shutdown, which precluded compilation of and access to NOAA's latest tide-gauge records.
The lead on the project, VIMS emeritus professor John Boon, says the report cards add value by providing sea-level projections that are updated more frequently than those issued by NOAA or other agencies.
Boon and colleagues also use a statistical approach that includes evidence for recent acceleration in the rate of sea-level change at many U.S. tide-gauge stations, and stress their use of relative sea-level measurements -- changes in water level relative to the land surface on which people live and work. The relative sea-level rise in Virginia and other East and Gulf coast areas is due to both rising water and sinking land.
This year's report cards, updated using monthly summaries of daily tide gauge records from calendar year 2018, show that trends in sea-level change generally held steady across the 32 stations, although the processes that control sea level fluctuated slightly from region to region.
Molly Mitchell, the VIMS marine scientist who compiled and analyzed this year's tide-gauge data, highlights two features of the sea-level report cards for 2018.
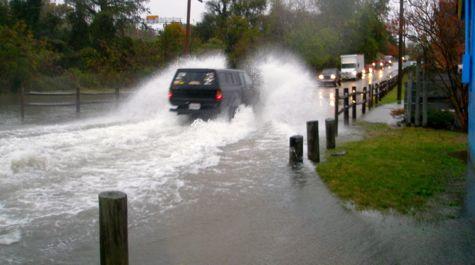 Storm Tide Coastal flooding is of increasing concern to communities in Virginia and around the nation. Photo by Patrick Lynch
First is the clear signal of September's Hurricane Florence as captured in the tide-gauge record for Wilmington, North Carolina. "Heavy rainfall in North Carolina contributed to high water levels at Wilmington throughout the fall," says Mitchell, "although this had only a minor impact on the long-term trend since it was a temporary increase." Florence dropped from 20 to more than 30 inches of rain across most of coastal North Carolina between September 14th and 18th.
Mitchell also notes a noticeable acceleration in sea-level rise at five of the eight monitored locations along the California, Oregon, and Washington coasts. "Although sea level has been rising very slowly along the West Coast, models have been predicting that it will start to rise faster," she says. "The report cards from the past two years support this idea." Scientists suggest that the speed-up is due to a shift in wind patterns associated with the Pacific Decadal Oscillation, an El Niño-like pattern of climate variability.
Sea level along the Gulf Coast at Grand Isle, Louisiana and Galveston, Texas continued to rise at high rates in 2018 (7.75 millimeters per year at Grand Isle and 6.19 mm/year at Galveston), while showing no sign of significant acceleration at either location. Should the lack of acceleration continue, projected sea level through 2050 for these locations will roughly equal that for Norfolk, Virginia (about 0.49 meters [1.6 feet] above 1992 levels), even though their rise rates are presently much greater -- first and third highest of the 32 monitored locations.
A high-rise rate (6.72 mm/year) is also found at Rockport, Texas south of Galveston but here the measured acceleration through 2018 is the highest of any location at 0.240 mm/year2, making its year 2050 projection correspondingly high at 0.78 meter (2.6 feet) above 1992 levels. Mitchell and Boon attribute the locally high-rise rates and sharp contrast in acceleration among these Gulf Coast stations to their location within a sedimentary basin with a complex history of water and hydrocarbon extraction. Pumping of groundwater and oil can cause land subsidence, which contributes to relative sea-level rise.
The Value of an Annual, Localized Report Card
Because long-term changes in sea level are typically on the order of a few millimeters per year, researchers have traditionally felt little need to issue frequent forecasts of sea-level changes. Moreover, many sea-level projections are global in scope, with a forecast horizon of 2100 -- far enough off to allow for readily discernible linear change. Thus, the United Nation's oft-reported projection of 44 to 74 centimeters (1.4 to 2.4 feet) of absolute sea-level rise by the end of the century.
The VIMS team has purposefully taken a more localized and timely approach, one designed to add maximum value for coastal residents, businesses, and governments.
Says Boon, "Our report cards show what sea level has been doing recently, what's happening now at your locality. Numerous studies show that local rates of sea-level rise and acceleration differ substantially from the global rates published by the IPCC and NOAA -- a key result because local rates of relative sea-level rise give a direct indication of the extent to which homes, buildings, and roads are at risk of flooding."
The team's decision to use a subset of available tide-gauge data runs counter to the traditional approach taken by NOAA, the agency that operates the nation's official network of tidal stations. "NOAA should be commended for their care in ensuring the continuity, consistency, and availability of the nation's long-term tidal datasets," says Boon. "But at the same time, a longer record isn't always better, especially when there's evidence of recent non-linear changes in the rate of sea-level rise like we see along the U.S. East Coast."
An earlier analysis by Boon showed that this acceleration began in 1987, at the center of a 36-year sliding window beginning in 1969 -- thus setting the start date for the VIMS report cards. This is decades after many U.S. tide-gauge stations began operation but within a span where many more stations now have complete or nearly complete records. Given recent evidence of ongoing warming, it makes sense in a nation-wide, comparative study of sea-level change to analyze only those observations made over the same period of time.
Mitchell explains further, "If you cross a threshold in terms of something like sea-level rise, what came before -- say a tide-gauge record that began in 1900 -- is biased in terms of seeing where you're going. We think the ice sheets are melting faster today than they ever have, and if that's true then the previous 90 years of data won't accurately predict the future."
The difference between the linear rates used in NOAA's sea-level forecasts and the non-linear, accelerating rates used in VIMS' report cards can lead to sharply different forecasts of our sea-level future. Extending NOAA's linear sea-level projections to mid-century for the tide gauge in Norfolk, Virginia indicates that sea level here will be 0.3 meters (11.8 inches) higher by 2050, while the VIMS forecast -- using a non-linear, accelerating rate -- is 0.49 meters, or 19.3 inches. That extra 20 centimeters (8 inches) of sea-level rise would have major implications for the low-lying region.
The VIMS team moreover cautions that sea level is likely to experience short-term variations in the future just as it does today. Thus, coastal residents and planners in Virginia and other areas likely to experience significant sea-level increases by 2050 must also account for storm surges and other transient forces raising sea level even higher than the projected mean rise value. The 95% confidence bands placed about the projected quadratic curve in VIMS' sea-level report cards are a further reminder that average sea level in any given month can deviate from the projected annual mean by as much as 20 centimeters (8 inches).
Story by David Malmquist
Visit the report card webpage for full-size, interactive versions of all 32 report cards.